| • Circles and Sectors |
| Circles and Sectors
The shaded regions above are called
sectors of the circle.
1. Estimate the degree measure of each sector. Explain your
thinking.
2. Using your estimates, determine the fractional part of the
circle represented by each sector. Show how you know.
Use your fractions to be sure that your estimates account for
the whole circle?
3. Using your estimates, determine the percent of the circle
represented by each sector. How can you use your percents
to be sure that your estimates account for the whole circle?
4. If the radius of this circle were 4 inches, what would its
area be? Show your calculations.
5. Using your estimates, give the area of each sector of the
circle. Show how you might check your work.
*********************************************************************************
Circles and Sectors
Discussion, Suggestions, Possible
Solutions
The purpose of this task is to help students get ready to draw
accurate circle graphs. Before beginning the tasks, students
should know that there are 360° in a complete revolution, how to
use a protractor, and how to calculate the area of a circle.
Possible solution:
1. The number of degrees in each sector should be estimated,
moving clockwise from North, at around 90 degrees, 30
degrees, 90 degrees and 150 degrees. Students should see the
angle in the top, right quadrant and “bottom” angle as
about 90 degrees and estimate the other two based on these
estimates.
2. Students should use ratios as part-to-whole relationships in
representing the sectors as fractional parts of the circle:
 of the circle, of the circle,
 of the circle, of the circle,
 of the circle. Students
should know that the sum of the circle. Students
should know that the sum
of their fractions should be very close to 1.
3. Students should be able to convert from fractions to percents
and know that the sum of their percents should be near
100% since they are estimating-exactly 100% if they made sure
that the sum of their degrees is 360 degrees.

.
This is a good place to discuss what happens when we add
repeating decimals. Ask students what they get when they
add  and and
 . They can readily see that
they get . They can readily see that
they get  or or
 which is 50%. Ask what this
might suggest about which is 50%. Ask what this
might suggest about
 . What does that suggest
about . What does that suggest
about
 . .
4. A = πr2=16 π≈50.24 square inches
5. .25(50.24) = 12.6 square inches, .0833(50.24) = 4.2 square
inches, ,4166…(50.24) = 20.9 square inches.
2(12.6) + 4.2 + 20.9 = 50.3 square inches. A = πr2=16
Π≈50.24 square inches.
|
• Data and Circle Graphs
This culminating task represents the level of depth and rigor
and complexity expected of all 6th grade students to demonstrate
evidence of learning. |
| UNIT FIVE TASK: “Data and Circle
Graphs” |
Forty middle school students were asked how many CDs they own.
The responses were as follows:
6, 2, 38, 27, 22, 36, 11, 43, 26, 19, 61, 0, 30, 16, 23, 38, 17,
20, 25, 29, 28, 19, 16, 24, 29, 45, 16, 20, 19, 8, 12, 27, 27,
28, 3, 13, 21, 20, 22, 27
a. Organize the data into a grouped frequency table with no more
than 6 classes.
b. Represent you data using a circle graph. Show and explain all
of your calculations. Be sure that your sectors are
drawn accurately and that your graph is attractive and easy to
read.
c. If this data were representative of your class, how many
students would fall into each of the sectors on your graph?
Explain your thinking and show how you know.
If this data were representative of all students in your school,
how many students would fall into each of the sectors on
your graph? Explain your thinking and show how you know. |
|
Standards Addressed in this Task |
M6D1. Students will pose questions, collect data, represent
and analyze the data,
and interpret results.
b. Using data, construct frequency distributions, frequency
tables, and graphs.
c. Choose appropriate graphs to be consistent with the nature of
the data (categorical or numerical). Graphs should
include pictographs, histograms, bar graphs, line graphs, circle
graphs, and line plots.
d. Use tables and graphs to examine variation that occurs within
a group and variation that occurs between groups.
e. Relate the data analysis to the context of the questions
posed.
M6N1. Students will understand the meaning of the four
arithmetic operations as
related to positive rational numbers and will use these concepts
to solve problems.
d. Add and subtract fractions and mixed numbers with unlike
denominators.
e. Multiply and divide fractions and mixed numbers.
f. Use fractions, decimals, and percents interchangeably.
g. Solve problems involving fractions, decimals, and percents |
|
Concepts/Skills to Maintain |
• The number of degrees in a complete revolution
• Measuring angles using a protractor
• Drawing angles of a given degree |
|
Suggestions for Classroom Use |
While this task may serve as a summative assessment, it may also
be used for teaching and learning. It is important that all
elements of the task be addressed throughout the learning
process so that students understand what is expected of them.
This task, unlike those in other units, does not cover all of
the standards addressed in the unit. Although circles will be
addressed again in unit 8, it is important to be sure that
students understand the relationships and calculations addressed
in
this unit.
• Peer Review
• Display for parent night
• Place in portfolio
• Photographs |
|
Discussion, Suggestions and Possible Solutions |
a. Students may use different classes to group their data. One
reasonable grouped frequency table is presented below.
| Number of CDs
Owned |
Frequency |
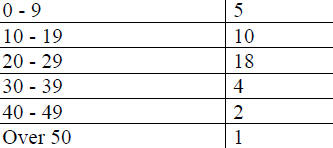 |
b. Calculations for circle graph (based on
data grouped as shown in the above table).
• 5/40 = 1/8 = .125 = 12.5%; number of degrees in sector = .125
x 360 = 45 degrees or 1/8 x 360 = 45 degrees
a. 10/40 = ¼ = .25 = 25%; number of degrees in sector = .25 x
360 = ¼ x 360 = 90 degrees
b. 18/40 = 9/20 = .45 = 45%; number of degrees in sector = .45 x
360 = 9/20 x 360 = 162 degrees
c. 4/40 = 1/10 = .10 = 10%; number of degrees in circle = ,1 x
360 = 1/10 x 360 = 36 degrees
d. 2/40 = 1/20 = .05 = 5%; number of degrees in sector = 18
degrees
e. 1/40 = .025 = 2.5 %; number of degrees in sector = 9 degrees
Encourage students to use methods easiest for them when
computing. Help them utilize the simple proportional
relationships that exist here. (i.e. 2/40 is one half of 4/40 so
one half of 36 degrees is 18 degrees, etc. Ask questions that
prompt them to check their work by adding percents to obtain
100%, fractions to obtain 1 whole and/or degrees to
obtain 360 degrees. Graphs should be carefully labeled, neat
and accurate.
| Number of CDs Owned
 |
Number of CDs Owned
 |
c.- d. Answers will vary for parts c and
d. Students may need to do some research to determine the number
of students in
their school |
|